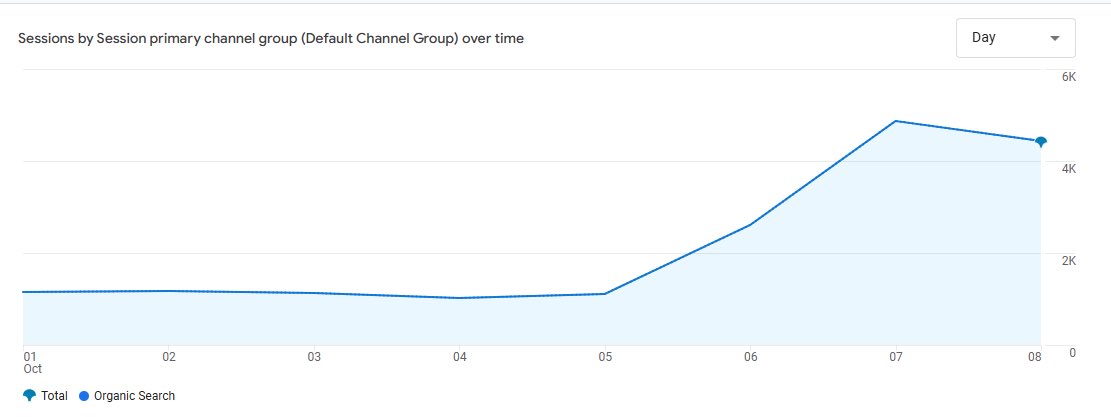
There are a nice number of reports of GA4, Google Analytics, showing a huge surge in organic search traffic over the past couple of days, but Google Search Console is not showing any increase, it remains flat. Some are suspecting this is the result of fake bot traffic not being filtered by GA4, but others are not sure.
It seems to be focused on e-commerce sites, but not any specific platform or CMS.
Alan Lucy posted on X a chart showing this, and wrote, "We're seeing it across dozens of clients on different CMS platforms and GSC looks normal. It clearly seems to be bot traffic."
Steve Peron from Collective42 noticed the same thing with several e-commmerce clients of his. And they are using different CMS/e-commerce platforms.
Steve told me, "So I dug deeper into GA, and across all four sites I noticed a clear pattern. The spike in Google organic traffic is coming from desktop users on Windows with a screen size of 1280x720. Engagement metrics are terrible, like 2 seconds on site. It's not coming a from a specific country or just to the homepage. Traffic is spread out."
"I'm also seeing these spikes reflected in both Shopify and BigCommerce analytics, so it's definitely not just a GA issue," he added.
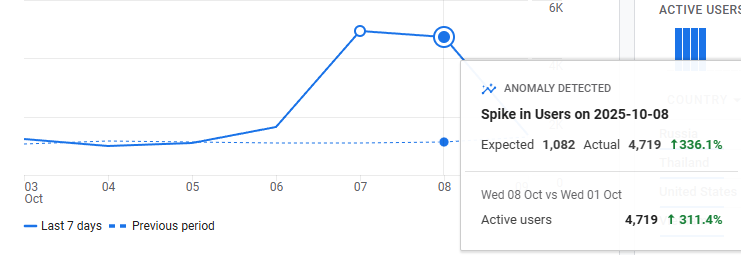
Deyan Georgiev, SEO Consultant & Founder of TORO RANK told me:
Between October 7th and 8th, GA4 flagged an anomaly - a +336% spike in organic users. However, Search Console data stayed flat. The sessions looked real on the surface, but the OS mix and lack of GSC correlation suggest GA4 may be counting automated or misattributed traffic as google / organic. It's the biggest mismatch I've seen so far between the two systems.
Here are his screenshots he sent me:
GA4:
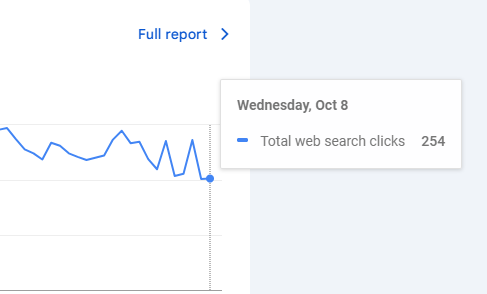
GSC:
But again, none of this is being shown in Google Search Console. So it doesn't seem to be related to the ranking volatility we reported on.
It does seem to be some sort of bot traffic.
I also am hearing about this in private SEO forums, so I cannot share those graphs or stories, because they are private...
Starting October 6 we've been seeing a dramatic spike in activity on our Shopify and GA4 reports that wasn't being reflected on GSC. This activity didn't come with a corresponding rise in ecommerce sales as it normally does and has a low engagement time.
Yes, for all my e-commerce clients, I am noticing a huge spike in organic traffic. pic.twitter.com/n0bQVvNJN8
Analyze User Behavior Across Different Devices and Platforms
Inform SEO Strategy
Improve Marketing Campaign Performance
Create Accurate Customer Personas
Analyze Ecommerce Performance
Improve User Experience
GA4 Setup Guide: How to Get Started With GA4
How to Set Up Google Analytics 4: Step-by-Step Guide
Step 1: Create an Account
Step 2: Add Account Name and Edit Settings
Step 3: Set Up Your Property
Step 4: Set Up a Data Stream
How to Add a Web Data Stream
Step 5: Add the GA4 Tracking Code to Your Website
How to Add GA4 to a Pre-generated GA4 Property
Access Setup Assistant
How to Know If GA4 Is Working
Troubleshooting Tips
Connecting GA4 With Other Google Products
Universal Analytics (UA) vs. GA4
Data Models
Metrics and Measurement
Device Tracking Capabilities
Privacy and User Data Control
Customer Journey Analysis
Conversion Tracking
Data Setup and Integration
Reporting and Customization
The GA4 Interface (+ Key Metrics)
The Main Navigation
Home
Reports
Real-time
Life Cycle
Acquisition
Overview
User Acquisition
Traffic Acquisition
Engagement
Events
Conversions
Pages & Screens
Landing Page
Monetization
The Search Console
Explore
Advertising
GA4 for SEO: Three Practical Tips
Keyword Performance Insights
Customizable Reporting
Search Function Insights
What Is Google Analytics (GA4)?
Google Analytics 4 (GA4) is a web analytics tool that helps you understand how people use your website or app. It can track every click, scroll, purchase, and other actions across various platforms and devices.
Unlike its predecessor, Universal Analytics, which was primarily session-based, GA4 introduces an event-based model.
What does this change mean for you?
You get more precise data collection capabilities and improved user privacy measures. Event-based tracking focuses on what visitors do. Not who they are. It’s less about tracking individual visitors and more about understanding user actions. Another key aspect of GA4 is its use of AI and machine learning, which makes predictions when data is limited. All good news for your data collection efforts.
What Is GA4 Used For?
You can use GA4 to get insights into user behaviors, navigational patterns, and the customer journey.
With its data, you can optimize your content, fine-tune your marketing strategies, and build more effective marketing funnels.
Whether you’re a business owner, data analyst, SEO professional, or digital marketing strategist, GA4 can help you better understand – and better serve – your visitors.
Here are some specific ways you can use GA4.
Analyze User Behavior Across Different Devices and Platforms
It’s a fact.
The customer journey is messy.
Customers weave across devices and platforms. Jumping from your website. To social. To search. And back again.
GA4 helps you get a complete understanding of this chaos.
With its cross-device and cross-platform tracking capabilities, you get an integrated view of the entire journey.
You’ll understand how your audience engages with each channel and moves between them on their way to a conversion.
With these insights, you can optimize your marketing across the whole ecosystem of touchpoints. Instead of individual channels in isolation.
Inform SEO Strategy
GA4 links up with Google Search Console, helping you with two things:
Discovering which keywords are bringing people to your site
Seeing what visitors do once they arrive
Looking at your data, you can answer questions such as:
Are visitors sticking around? Or bouncing off?
Are they clicking on affiliate links or downloading an ebook?
This information can then inform your SEO strategy.
For example, if a piece of content gets a lot of traffic and engagement, you could create more content around that keyword.
You can also track visitor journeys to understand the path from initial visit to conversion. You can then use that knowledge to optimize internal linking structures. All good news for your SEO strategy efforts.
Improve Marketing Campaign Performance
Want to know if your marketing campaigns are a success or a dud?
GA4 can answer that.
Are you trying to figure out which influencers are bringing in engaged traffic during your campaigns?
GA4 can help you track that, too.
Want to see the real impact of your ads on conversions?
Done.
With GA4’s ability to track behavior across different channels – plus the insights of its AI assistant – you get a clear picture of the entire customer journey.
This means you’re better equipped to fine-tune and optimize every step of that journey—right down to the finest details.
Create Accurate Customer Personas
GA4 helps you gauge the intent of website visitors based on behavior data.
This means you can segment your audience with precision. And create customer personas that mirror their reality.
The result?
Targeted content and marketing campaigns that make your audience feel like you’re talking directly to them.
Analyze Ecommerce Performance
GA4 provides granular ecommerce analytics – from product views to refund rates.
These insights help ecommerce teams optimize inventory, merchandising, and site experience based on how customers shop.
For example, you may discover the blue color variation of a shirt sells 3x more than other colors.
You can use this insight to decide which items to increase stock for. And which ones may need a rethink in your inventory.
Improve User Experience
GA4 revolves around a core principle: tracking customer behavior.
Are your visitors clicking? Reading? Scrolling? Watching Videos? Buying? Bouncing off as soon as they arrive?
With this fly-on-the-wall perspective, you’ll have data to guide how you can improve user experiences on your website or app.
GA4 Setup Guide: How to Get Started With GA4
Time to set up GA4.
If you’ve had a Universal Analytics account, there’s a good chance you already have a pre-generated GA4 property.
Note: When UA was phased out, Google automatically added GA4 properties to existing accounts. Most users will find an initial, incomplete GA4 setup ready for them unless they have opted out.
Haven’t used UA before? You’ll start by creating a new GA4 account.
Either way, there’s setup work to be done.
To get started, make sure you have access to:
The Google Marketing Platform website
Your website’s backend
Got those? Great! Let’s proceed.
How to Set Up Google Analytics 4: Step-by-Step Guide
Never used Google Analytics before? Here’s what you need to do.
Step 1: Create an Account
Go to the Google Marketing Platform and click “Sign in to Google Marketing Platform.”
Click the “Set up” button under Analytics.
Then, click the “Start measuring” in the window that follows.
This takes you to the “Create an account” page.
Step 2: Add Account Name and Edit Settings
Type in your name in the “Account Name” box. This is typically your business or website name.
Then, tick the data you want to share with Google.
Click “Next.”
Step 3: Set Up Your Property
In the “Property name” box, type out the name of your URL. And set the “Reporting time zone” and “Currency” to match your business preferences.
When you hit “Next,” you’ll be prompted to answer a few business-related questions.
You’ll then need to state your Google Analytics objectives. Choose one.
Lastly, accept the Google Analytics 4 terms of service.
Step 4: Set Up a Data Stream
In GA4, both web and app data are incorporated through a feature known as a data stream.
Add a separate data stream for each platform you’re using.
Here’s how.
How to Add a Web Data Stream
To add your website, click the “Web” button.
Then, add your URL. And give your site a “Stream name.”
We recommend leaving “Enhanced measurement” turned on.
Click “Create stream.”
This will allow GA4 to automatically track actions like video plays, link clicks, downloads, and more.
After clicking “Create Stream,” you’ll see your Web stream details.
Click “View tag instructions” to get the installation instructions for adding the GA4 code to your website or CMS such as WordPress or Shopify.
Step 5: Add the GA4 Tracking Code to Your Website
Next, you’ll need to link your website to GA4 by installing the tracking code to your website.
This enables GA4 to collect data from your site.
You have three options to add this code to your website:
Install manually
Install with a CMS or a website builder
Use Google Tag Manager
For this GA4 tutorial, we’ll focus on the manual installation.
After clicking “View tag instructions” in the previous step, you’ll see detailed instructions for the installation process.
These instructions are designed to help you smoothly integrate the GA4 code, whether using a standard web platform or a CMS like WordPress or Shopify.
Here’s how to proceed:
Click “Install manually” to access the JavaScript code.
Then, copy the code.
This code must be added to the <head> element of every page on your site.
The method varies based on the CMS or website platform you’re using.
For example:
In WordPress, you can add the code using a plugin like “Insert Headers and Footers” or by editing the theme’s header template.
In Shopify, you can add the code directly into the Google Analytics section within the Shopify admin dashboard.
How to Add GA4 to a Pre-generated GA4 Property
First, check if there is a pre-generated property in your account.
Click “All accounts” at the top left corner of the GA4 interface.
This will open a list showing all the properties linked to your account.
Browse through the list to find a GA4 property for the specific website or app you’re interested in setting up with GA4.
If you find one, click on it to access that property’s details.
This will open a list showing all the properties linked to your account.
Browse through the list to find a GA4 property for the specific website or app you’re interested in setting up with GA4.
If you find one, click on it to access that property’s details.
Click on the “Go to Setup Assistant” to access the GA4 setup assistant, which will guide you through the rest of the setup process.
Click on the “Go to Setup Assistant” to access the GA4 setup assistant, which will guide you through the rest of the setup process.
Click on “Go to your GA4 property” to continue the setup.
The Setup Assistant will guide you through an 8-step process, with a progress bar to track your progress.
Notice that there are three priority steps to start tracking:
Collect website and app data
Turn on Google signals
Set up conversions
Follow each step, selecting options that fit your use of Google Analytics.
How to Know If GA4 Is Working
Here’s how to confirm that Google Analytics 4 (GA4) is working correctly.
Navigate to “Reports” > “Real-time.”
Next, open your website in a separate browser window.
Then, return to the GA4 real-time report in Google Analytics.
If GA4 is correctly set up, you should see details such as your location and the page you’re currently viewing reflected in the report.
Troubleshooting Tips If data isn’t showing up as expected:
Use the Google Tag Assistant to check if the tracking code is correctly installed on your website.
Use GA4’s DebugView feature to flag any errors with event tracking.
If you’re using Google Tag Manager, verify that your GA4 configuration tag is properly set up.
Note: Data typically appears in GA4 reports outside of the Real-time section within 24 – 48 hours.
Connecting GA4 With Other Google Products
Linking GA4 to Google products, such as Google Ads and Google Search Console, can be very useful for your marketing campaigns. It sharpens your strategy by revealing exactly how users find and interact with your site.
Ready to link up? We’ll guide you through it.
For this example, you’ll connect to Google Search Console.
Note that connecting to other Google products follows the same straightforward manner.
Go to the Admin menu at the bottom left and click “Product links.”
Here, you’ll find a list of tools that can be connected to GA4.
Click “Search Console links.
Then, click “Link” in the window that follows.
Click “Choose accounts”.
A new window will appear, showing Google Search Console accounts linked to your email.
Check the box next to the Property Name you want to add and click “Confirm.”
You’ll be taken to the “Link setup” window. Click “Next”.
Click “Select” to pick the appropriate web stream.
In the “Choose a data stream” window, pick the appropriate data stream.
This will take you back to the link setup window.
Here, click “Next” to proceed.
Review the details to ensure the property and web streams are matched correctly.
To finalize the integration process, confirm your settings by clicking “Submit.”
Universal Analytics (UA) vs. GA4
The transition from Universal Analytics to GA4 has been quite a shock to the system for many.
And with good reason.
This shift isn’t as simple as clicking a button.
And the differences between the two can feel quite stark.
So first, breathe.
Now, let’s make this transition easier for you.
Let’s bridge the gap between the familiar features of UA and the new features of GA4—so you don’t feel so lost when you’re navigating the GA4 interface.
Let’s go.
Data Models
UA and GA4’s different data models mean they collect and analyze data differently.
UA tracked user sessions and pageviews.
GA4 tracks user interactions—like clicks, purchases, and form submissions.
So what does this mean?
UA could tell you that a user visited a product page.
GA4 can also tell you that. And more.
It can give you the specifics:
Which images users clicked.
Whether they added items to their shopping carts.
And how far down the page they scrolled.
This level of detail in reporting was not possible with UA.
Metrics and Measurement
In Universal Analytics, the core functionality relied on metrics such as “sessions,” “pageviews,” “bounce rate,” and “conversion rate.”
Google Analytics 4 retains these traditional metrics.
However, it places a greater emphasis on event-based metrics.
This is why the GA4 user interface looks different by default.
You’ll see less prominence given to metrics like “bounce rate.”
And more focus on metrics such as “Engagement Time,” “Scroll Depth,” and “Engagement Rate.”
Device Tracking Capabilities
The device tracking in UA had its limitations – especially when integrating user journeys across multiple devices.
GA4, on the other hand, natively supports cross-device and cross-platform tracking.
Here’s why that matters.
In UA, when a person started their customer journey on a laptop and completed the purchase on a smartphone, the person may be recorded as two separate users.
In GA4, that same person is assigned an anonymized unique User ID.
This ID links all their interactions across different devices.
This means the journey that begins on a laptop and concludes with a purchase on a smartphone is recognized as a continuous experience by a single user.
Privacy and User Data Control
UA relied on cookie-based tracking.
GA4 is designed for a cookie-less future. While it uses cookies at the moment, this is soon going to be deprecated.
Customer Journey Analysis
UA had sessions and pageviews rather than continuous user journeys.
To analyze a user’s journey through your site, you’d often find yourself stitching together separate sessions.
Now, with GA4, you can capture user journeys more comprehensively.
And have an uninterrupted view of user interactions across your website.
Conversion Tracking
In UA, you had to set up specific goals and funnels, which could be a detailed and sometimes complex process.
GA4 simplifies this by automatically capturing standard events.
This change means less manual setup and more intuitive tracking.
The benefits?
With GA4’s sophisticated ecommerce tracking, you can have a clearer understanding of user transactions, revenue, and product performance.
Data Setup and Integration
Unlike UA, which required creating separate properties for different platforms, such as web (desktop) and mobile devices, GA4 simplifies the process.
You simply set up separate data streams for each platform with a few button clicks.
After that, GA4 handles the heavy lifting by pulling all that different data together for you.
Reporting and Customization
One of the main features of GA4 is its highly customizable reports.
Yes, there are predefined reports when you first use it.
But the real power lies in your ability to tailor them to display only the data you need.
Through the “Exploration” features, you can combine, segment, and analyze data to craft custom reports.
This wasn’t available in UA.
Customization was possible—to some extent—through custom dimensions and custom metrics.
But it was relatively limited.
Sidenote:We’re not saying GA4 is perfect. Honestly, we’re still warming up to it. But it’s here to stay. As we mentioned at the start of this article, getting to grips with GA4 is a learning curve. Focusing on the positive aspects, though, will likely ease the transition.
Below is a table of the differences between UA and GA4 for easy reference.
Feature
Universal Analytics (UA)
Google Analytics 4 (GA4)
Data Model
Session-based data model with a focus on user sessions and pageviews
Event-based model treating every interaction as an event
Metrics and Measurement
Central metrics: Pageviews, Sessions, Bounce Rate
New metrics like Engagement Time, Scroll Depth, Engagement Rate
Device Tracking Capabilities
Limited, especially across multiple devices
Native support for cross-device and cross-platform tracking
Privacy and User Data Control
Cookie-based
Enhanced user data and privacy controls
Conversion Tracking
Specific actions designated as conversion goals
Any event can be a conversion
Data Setup and Integration
Separate property setups required for different platforms (web, mobile)
Unified property setup for multiple data streams (web, iOS, Android)
Reporting and Customization
Standard, predefined reports with some level of customization
Highly customizable for tailored reports
The GA4 Interface (+ Key Metrics)
Time to play around with GA4. And get familiar with its interface.
Here’s where everything is:
At the top left corner is the main menu
On the left sidebar, you’ll find the primary navigation menu,
The central area displays the reports or analyses you select from the left sidebar.
At the top middle is the search bar
On the bottom left, you have your admin button
In the top right corner, you’ll find your account information
Now, let’s look at the main navigation, where you’ll be spending a lot of your time.
The Main Navigation
The main navigation holds the different types of reports in GA4. It includes:
Home
Reports
Explore
Advertising
Admin
“Home” is your default landing page when you log in to GA4. It’s an at-a-glance view of key reports. It’s customizable, so you can change different widgets based on your preferences.
“Reports” provide data about your website’s traffic and measure activity of your users, including their actions, engagement levels, traffic sources, and conversion metrics.
“Explore” is where you create custom reports and data visualizations.
“Advertising” shows you the attribution reports. Here, you can see data on how different channels lead to conversions.
“Admin” is where you can access account settings.
Home The first on the sidebar menu is “Home.”
Here’s what the default dashboard looks like.
On the main card, you can see “Users,” “Conversions,” “Event count,” and “Sessions.”
By default, these metrics are set to show the last seven days. But you can change this window at the bottom left-hand side.
On the card to the right, you’ll see the number of users in the last 30 minutes.
Like in Universal Analytics, each bar on the chart represents each minute in the last half hour.
If you hover your mouse over one of the bars, you can see exactly how many visitors you had 12 minutes ago, for example:
Reports The Reports section is the beating heart of GA4’s analysis capabilities.
It’s where you find data about your website and/or app traffic.
You’ll find Reports under the home button.
Click “Reports.” And you’ll see the “Reports snapshot.”
This snapshot looks a lot like the home report above.
This is a condensed overview of your data. It’s designed to give you quick access to metrics and trends without having to create or explore more of your custom reports.
If you scroll down, you will also find an overview of other reports, such as your top events, top conversions, top-selling products, and more.
Real-time Under “Reports,” you’ll also find “Real-time” reports.
Clicking this will open a window showing the activities of visitors currently browsing your site.
At a glance, you can see the types of devices your active users are using – phone, tablet, or desktop.
Using the large world map, you can also review where your users are currently browsing from.
If you scroll down the page, you’ll see:
The “Users by First user source” section, which shows where users were before they arrived on your site
The “Users by audience” section, which categorizes users into segments or groups – based on criteria you’ve set
The “Views by Page title and screen name” section, which shows which pages or screens are being viewed
Life Cycle
Below “Real-time” Reports, you’ll find “Life cycle,” which has four reports on the entire lifecycle of individual user:
Acquisition
Engagement
Monetization
Retention
Overview
Click “Acquisition” > “Overview”
Here, you’ll see a general overview of your acquisition metrics.
You’ll see the same details as the ones in the “Home” reports and the “Reports snapshot.”
When you scroll down, you’ll find more data on the different channels about where your traffic is coming from.
User Acquisition “User acquisition” provides you with more data about your users.
This helps you understand which channels send the most traffic.
Organic? Social? Direct traffic?
You can find it all here.
Traffic Acquisition Traffic acquisition looks at how users arrive at your site for each user session.
It captures the sources of sessions beyond the first visit so you can see if the same sources are consistently driving repeat visits.
Engagement The engagement section has five sub-reports:
Overview
Events
Conversions
Pages & Screens
Landing page
These reports are designed to show you all the activities on your website or mobile apps.
And helps you understand how users interact with your platforms by connecting various data points of their journey.
It shows:
What pages or screens do visitors view
Custom events you have tracked as they interact with features
Conversions as a result of these interactions
Like other sections, it has an overview section that provides a top-level summary of user engagement.
Events “Events” shows you data on all the events you’re tracking.
Here, you’ll see user interactions that GA4 tracks as events by default, as well as the events you have defined yourself.
Scroll down to see a list with more data on the events you’re tracking.
Clicking any of these events will give you deeper insights about that specific interaction.
Conversions The “Conversions” section displays the total number of conversions within your selected date range.
These are based on the events that you’ve designated as conversions, which could range from form submissions and purchases to other key user actions.
Pages & Screens For insights into how users interact with individual pages on your website or screens in your app, head over to “Pages and Screens.”
The data helps you understand which content people engage with and how it contributes to the overall journey on your site or app.
Landing Page The “Landing page” section reports on the first pages visitors land on when they arrive at your website.
It shows the pages where visitors first enter your site.
This can help you understand which pages are most effective in attracting visitors.
And also helps you assess the marketing performance of your campaigns and SEO efforts.
Monetization Ecommerce websites will find themselves frequently using the monetization section.
Here, you’ll find a comprehensive view of the revenue generated by your website or app. As well as insights into shopping behavior.
Under Monetization, you’ll find details on:
Ecommerce purchases
Purchase journey
Checkout journey
In-app purchases
Publisher ads
Promotions
The Search Console You can easily connect Google Search Console to your analytics account.
To analyze search queries in GA4, you must first establish a connection with your Google Search Console account.
We cover the steps here if you haven’t set this up yet.
Explore The “Explore” section is where you create custom reports.
You have the option to start a custom report from scratch. But the template gallery also includes ready-made reports such as:
Free-form for customizable, ad-hoc analysis
Funnel exploration for visualizing journeys
Path exploration to track and display the routes users take on your site
Segment overlap to compare different segments
Advertising Link Google Ads to your GA4 and get a clear picture of the performance of your ads.
This section provides insights into the impact of all your ads (including search ads).
It shows you which campaigns drive traffic and conversions to your site, helping you pinpoint what’s working and what’s not.
GA4 for SEO: Three Practical Tips Let’s explore key GA4 reports that can help you analyze your SEO performance.
1. Keyword Performance Insights To review keyword performance on GA4, you’ll need to connect Google Search Console (GSC) to it.